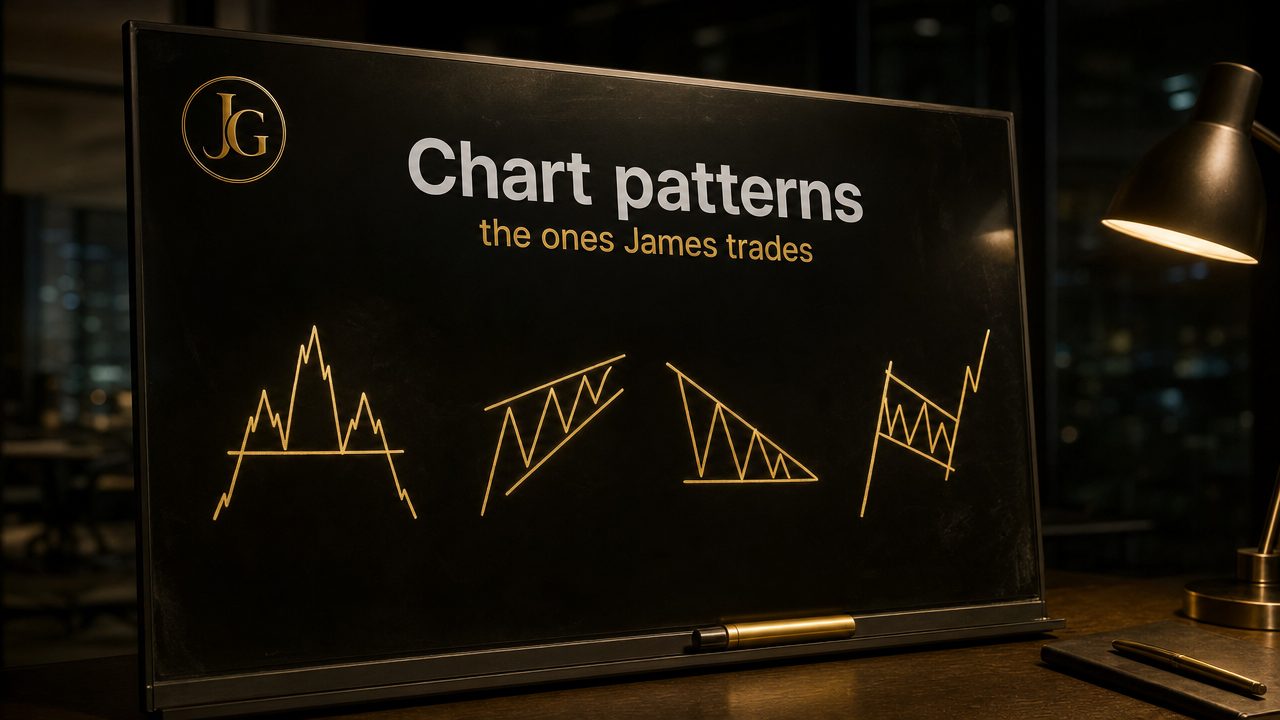
Seven patterns that come up again and again in James G's daily videos, each drawn step by step. Scroll to animate, or tap a pattern to replay it.
Pattern 1
Rising wedge
Price climbs inside two rising lines that squeeze together. Momentum fades with each push, and the usual resolution is a break down.
How James uses it: James flags it on Bitcoin's weekly chart and on Nvidia. He takes it as a reason to keep size small and buy orders lower, not to short blindly.
Pattern 2
Descending triangle
Lower highs press down on a flat floor. Pressure builds until price breaks the floor, or breaks out through the falling line.
How James uses it: On Tesla he showed price breaking up out of a descending triangle: "builds pressure and it's already breaking out".
Pattern 3
Bull flag
A sharp move up (the pole) followed by a tidy, slightly falling channel (the flag). A break above the flag often continues the trend.
How James uses it: He called the oil bull flag before it "started playing out" and broke to the upside.
Pattern 4
Head and shoulders
Three peaks, the middle one highest, sitting on a common neckline. A close below the neckline is the classic signal that a top is in.
How James uses it: On 26 October he pointed to a 4-hour head and shoulders on Bitcoin that he had warned about, and it played out.
Pattern 5
Inverse head and shoulders
The mirror image: three troughs, the middle lowest. A break above the neckline often marks a bottom.
How James uses it: He showed a large weekly inverse head and shoulders on oil, with a measured target near $144, and still took profit at resistance.
Pattern 6
Golden cross
A faster moving average crosses above a slower one. It shows the trend has turned up, but it lags price.
How James uses it: He noted a daily golden cross on Bitcoin and dropped a short idea because of it.
Pattern 7
Stochastic oversold / overbought
An oscillator from 0 to 100. Below 20 is oversold, above 80 overbought. Turns from those zones are early timing hints.
How James uses it: His simplest rule: buy when the weekly is oversold, be careful when it is overbought.
See them on live charts
Patterns are easier with a plan
Elite members see James's commentary and every AI trade plan with entry, targets and stop, so you can watch these setups play out in real time.